Six charts that explain the market right now.

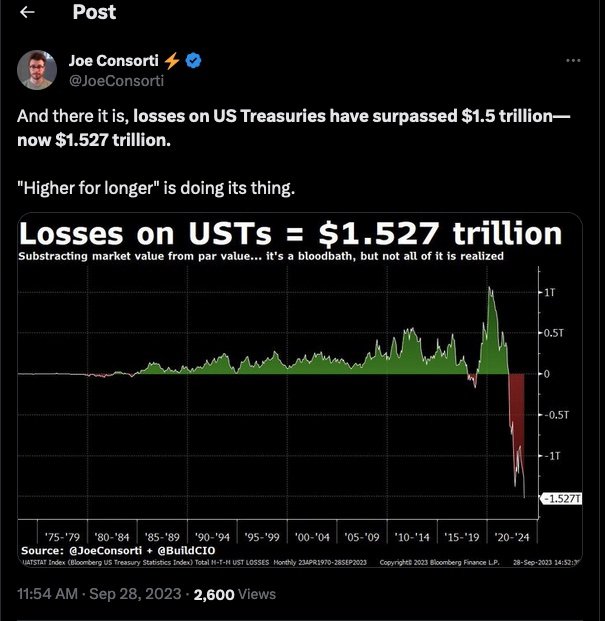
I have commented more than once about the risk of duration in my remarks this year.  While I don’t predict rate moves, I do look to avoid unnecessary risk…and being exposed to duration is not good right now.

Setting up the six charts: Eight points to keep it simple.

 1.     Per the Fed’s remarks last week, interest rates will remain at current levels (and possibly higher) for longer.  This is one of two reasons for the current market sell off.

 2.     The second reason is that the Fed no longer believes an economic soft landing is a high probability.  So the Fed seems to admit a recession is coming.  Raising rates into a recession is nearly unprecedented, but so is the ongoing trouble with inflation.

3.     Since the Fed meeting September 20th: the S&P500 and bonds have sold off a bit, both declined about 5% in less than a week’s time.

4.     10-year treasury yields have moved from 4.0% to 4.6% in a few months (that’s a lot).  It looks like 30-year mortgage rates are about to touch 8%.  Remember, the US economy runs on credit and it is getting much more expensive to operate with debt.

 5.     Traditional 60/40 is not doing well.  Stocks and Bonds declining together is not common and this is penalizing traditional 60/40 portfolios. 

 6.     The US equity market is being held up by less than 10 stocks.  Meta, Apple, Alphabet, Amazon, Netflix, Nvidia and Microsoft have been dubbed the magnificent seven.

 7.     Which means all of 60/40 is basically being held up by 7 stocks.

 8.     People aren’t even selling; major stock and bond ETFs are seeing big inflows.

So rates continue to rise and bond funds are getting slow walked into a wood chipper.  In contrast, buying short-term treasuries and holding them to maturity has been great, earning 4.0% to 5.0% yields, letting them mature…then buy another one at a slightly higher market rate.  Money Market Funds (a cash alternative) are also paying nearly 5%...it’s never been better to be both patient and cautious.

Despite the current weakness, it’s been a strong year for the S&P500, but the leadership is very narrow.  The equal weighted S&P500 demonstrates there is a lot of weakness among the other 493 stocks in the S&P500.

In my view, market uncertainty is high.  I’m heavy cash, short-term treasuries and dollar cost averaging into various US Equity exposures. I’ve also commented in the past about my interest in the Energy and Uranium sectors and both have been on a tear. 

Chart #1

The Magnificent Seven vs S&P500 vs the Equal Weight S&P500 (year to date performance, price only).

Chart #2

A 30-year treasury bond trading at 47 cents on the dollar…a rough 50% decline in value.  This is what duration risk looks like in a rising rate environment.  This bond paid a 1.25% coupon at the time it was issued, the new yield is about 4.75% at this price level.  Just 26 years to get back to par value.

Chart #3

This is the same chart as Chart #2, however this is a corporate bond issued by Apple Inc.  Want to buy some Apple at about 50 cents on the dollar?…the yield at these price levels is about 5.25%.  Luca is the CFO of Apple…I would guess that Apple will try to buy some of these bonds back to reduce their debt at a discount.  Sellers will be reluctant at these levels…so poor liquidity is now locked in.

Chart #4

This chart demonstrates how folks have been betting for a decline in rates, not an increase.  As a result, people are losing money in long duration bonds and the losses are enormous.  The TLT is a 20-year treasury bond ETF.

Chart #5

Total treasury bond losses are currently about $1.5 Trillion.  The largest owners of these bonds are the Fed, Insurance Companies, Banks, Pension Funds and other sovereign governments.  This figure does not include the corporate bond market.  This is why the banks fell into trouble earlier this year…which remains an issue.

Chart #6

Why are people piling into TLT?  Because if rates decline, you can make a lot of money and earn the coupon while you wait.  In additional to regular investors, hedge fund types will also do this – often with leverage.  Duration sensitivity goes both ways…and yes, this is starting to look like an interesting allocation.  But being early has been terrible.  I recommend folks avoid adding equity-like risk in the fixed income portion of a portfolio.  TLT is simply an easy and liquid ETF used to gain long duration exposure in the market.  There are many ways to replicate this type of duration exposure in other funds, TLT is just a popular example.

Sometime soon I suspect long duration bonds will be attractive and present an amazing return profile.  We’ll save that for another write up.  I hope you find this helpful.  Please don’t hesitate to be in touch with questions.

Previous
Previous

Do you have losses in your fixed income allocation?

Next
Next

Retirement Account Check Up…Prepare For Year-end.