Seven Charts to Frame 2022 and how to Approach 2023
US Equity Valuations:
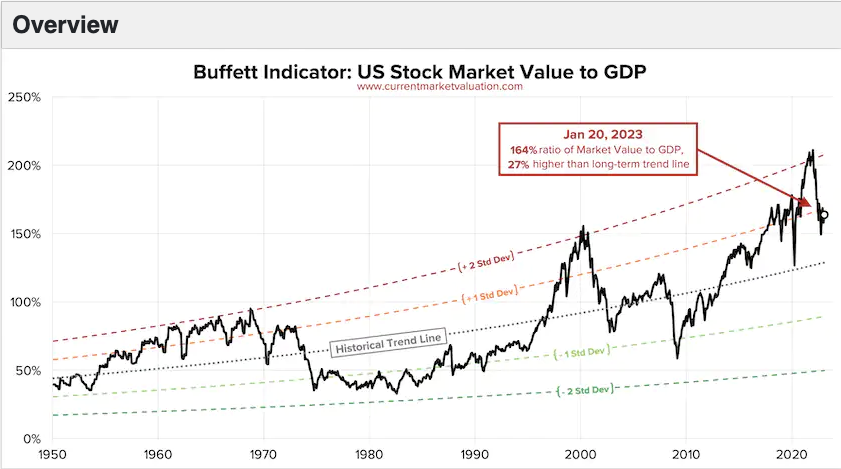
The Buffet Indicator is a measure of stock market valuations and is an overly simplified representation to answer the age old question – are stocks over or under valued. The risk-on euphoria during 2020-21 drove this measure to highly elevated levels similar to the 1999-2000 dot com era.
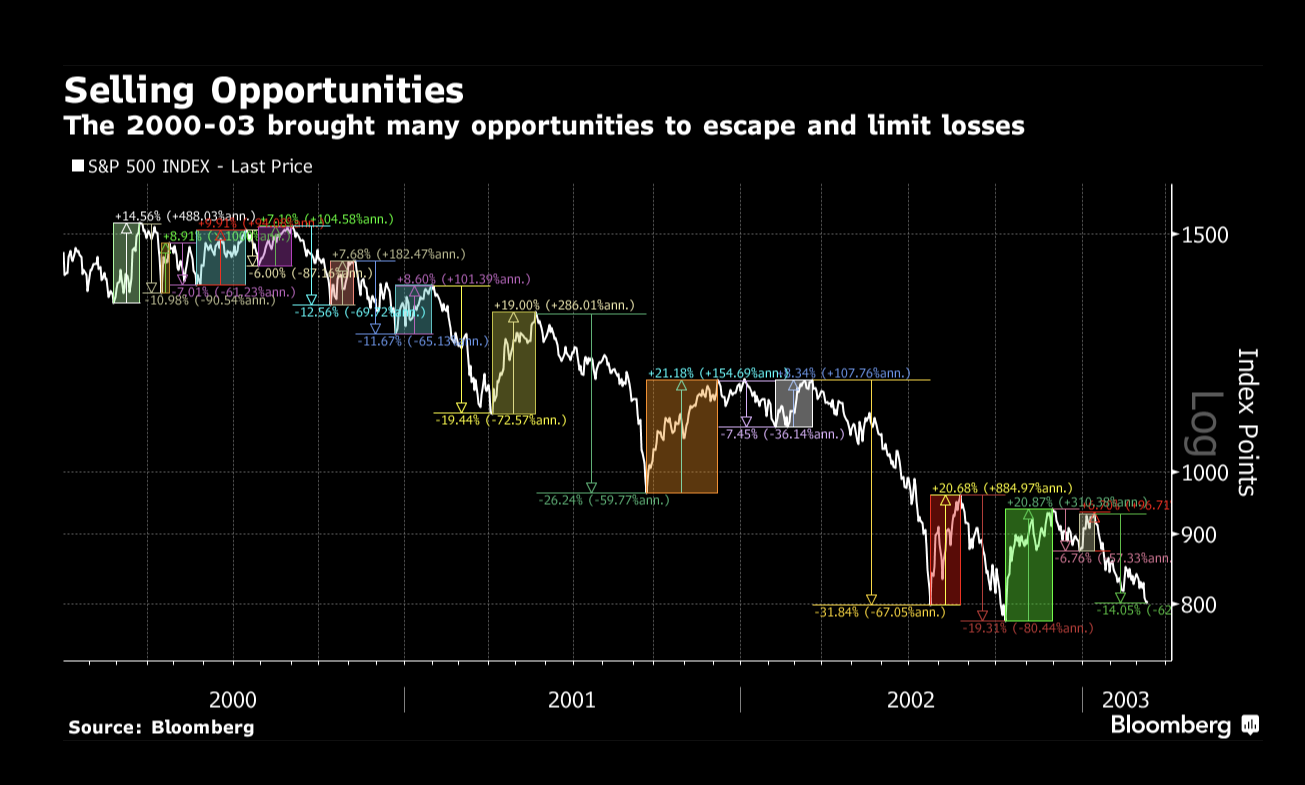
Keeping with the 1999-2000 market analog, the following chart was published by Bloomberg in MAY 2022 as a reminder of how tricky bear markets can be. Importantly, the chart depicts several steep bear market rallies along a three-year trend of decline (about -40%) for the S&P 500 in the 2000-2003 period.
The message from these first two charts is simple:
1.) Peak absurdity is a time to be cautious
2.) Bear markets can be a multi-year process
3.) While equity markets are hard to predict, cycles / entry points matter
How did 60/40 perform in 2022?
The historically conservative 60/40 (Equity / Bonds) portfolio had a terrible year. The past correlation of equity declines offset by declining interest rates (bonds up) did not work like it has in the past. The equity all-time highs in 2021 and simultaneous all-time lows (zero interest rate policy) turned out to be a perfect storm for 60/40. Given the low rate environment post 2008, the fixed income market environment offered extremely low yields across the investment grade risk spectrum. In my view, there was little reason to have much exposure to bonds in recent years because the income was so low – let alone the rising rate risk exposure. The reality for 60/40 is that 2022 has wiped out the last few years of returns…low return / high risk. Not the quadrant an investor wants to be in.
The S&P 500 had its 7th worst year, declining about 20%.

Just how poorly did bonds perform in 2022? This chart simply plots the calendar year returns for the Bloomberg Aggregate Bond Index since 1990, 2022 is the dark blue line heading south.

The most important question to analyze is this: What to do with a legacy 60/40 portfolio today? The answer is dependent on client specific metrics (age, income, asset profile, risk profile, etc). Regardless, I believe doing nothing will be a slow, multi-year time frame for investors to return to Dec 2021 levels. Ouch.
The S&P 500 vs. the Federal Reserve Balance Sheet:
I won’t attempt to tackle the Federal Reserve and their decisions that have endured since 2008 (moral hazard to $9 trillion). This chart is a simple reminder of the relationship for equity markets when the Fed is expanding/shrinking its balance sheet. It also demonstrates that the Federal Reserve is more important than any other factor driving equity and bond performance…so listen to the Fed carefully. They have clearly stated they are tightening and have no plans to pause as we enter 2023.

Looking to 2023:
The primary topic debated in the financial media today is when will the Fed pivot – when will they pause and/or reverse fiscal tightening? The sole purpose of this fever pitch focus is an expected and significant bounce in equities and bonds as well. I hate to disappoint you, but history shows the interest rate pivot point is not the bottom in equities…the US equity market bottom comes after the pivot as depicted below. The basis for a delayed equity bottom is simple, if the FED pivots it is a sign the economy is deteriorating – and can weaken further.

In terms of the factors that will drive the Federal Reserve to pivot and reduce rates, it seems the Fed’s current plan is entirely driven by inflation. The following chart from Bianco Research depicts that nearly every economic research team on Wall Street is forecasting a return to sub 3% inflation in late 2023 and 2024. It’s a guess. These are also the same experts that did not forecast the current inflation problem or the 425 basis points of Fed tightening in 2022.

Will a recession happen in 2023?
I don’t know…it seems the Fed is forced to rein in inflation at any cost and the data / mood so far implies a recession is possible in late 2023. Regardless, I believe a portfolio should be defensively positioned for a scenario where rates and inflation are higher / longer and volatility is elevated across all markets.
Core Portfolio:
Broad US Equity markets are cheaper, but not cheap. Consider a multi-year approach by dollar cost averaging into various US equity strategies. Consider US equity strategies that fall into three baskets; Large cap, Small cap and Dividend focused.
Interest rates are higher and offer attractive yields. Short-term US Treasury Bonds are currently offering risk-free yields of more than 4%. Building a laddered bond portfolio of 6-month to 3-year maturities (or longer) is a good place to allocate excess cash. Maturing bonds can be re-invested based on the environment at the time of maturity (equity, bonds or real estate).
Satellite Portfolio:
Given my defensive tone, I am doubly cautious on Satellite Portfolio Allocations as we enter 2023. With the exception of Energy stocks in 2022, asset correlations were generally 1.0 (i.e., nowhere to hide). If a recession materializes in 2023, expect more volatility and down-side correlations of 1.0 again in the short-term.
Watch List: Energy, MLPs, Healthcare, Utilities, Commodities.
Meme humor for the moment:

About Western Level:
Western Level Advisors LLC is an independent Registered Investment Advisor. The firm provides investment management and long-term financial planning services for individuals. All services are provided on a fiduciary and fee-only basis. Western Level’s only purpose is to establish a clear pathway for each client to help them manage and compound their wealth.