August 2023: Checking in on the market
Interest Rates:
Interest rates are edging higher. 2-Year Treasuries touched 5% more than once this summer.
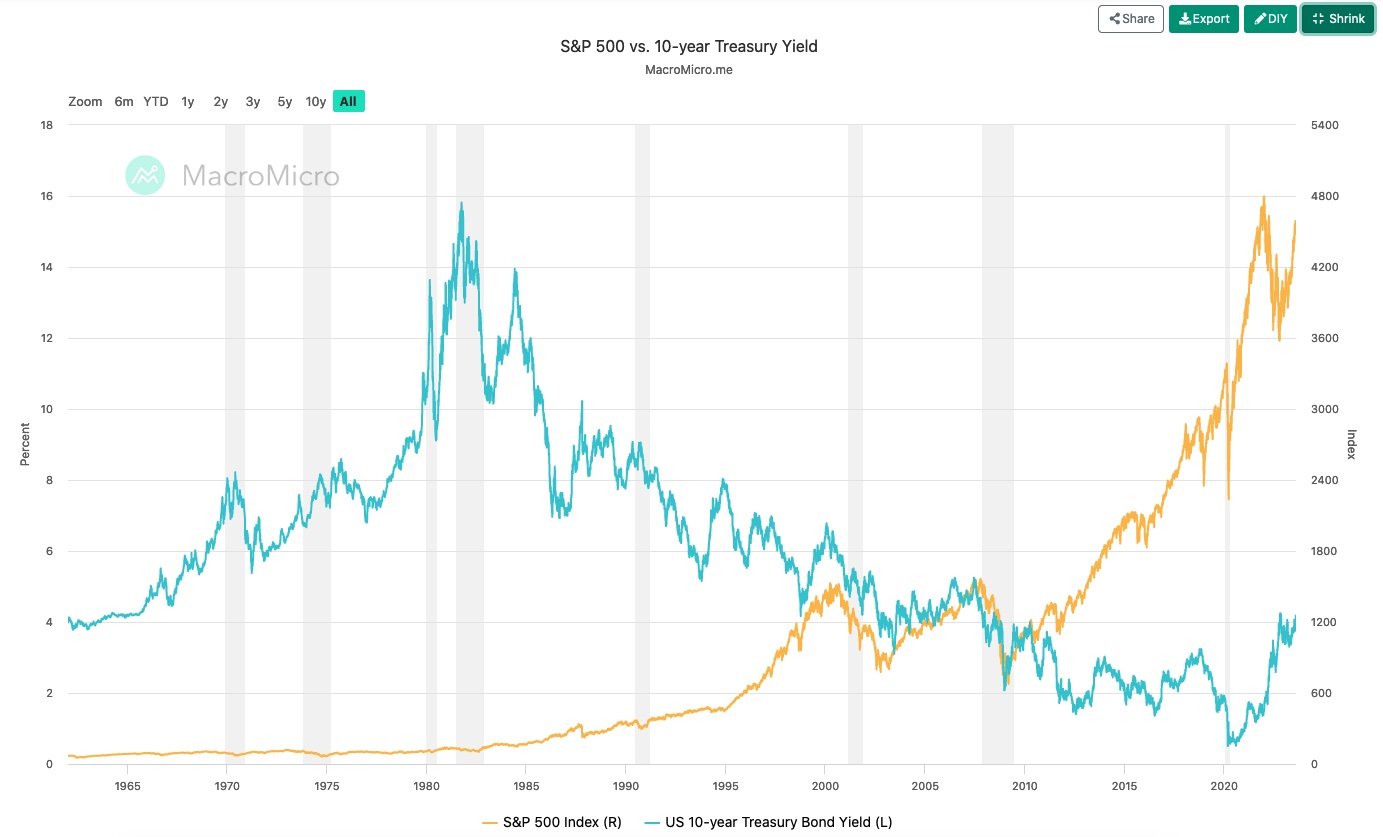
The 10-Year Treasury surpassed 4% last week - which is incredible relative to where rates were just a couple years ago (less than 1%, chart below).
While inflation has come down from extremely elevated rates, the harm is real and prices are not going to revert back to prior levels. The effect of higher rates and higher cost of goods seems to be delayed by a robust economy and decent employment environment. Meanwhile federal government spending is robust….so it’s unlikely that inflation and rates will return to meaningfully lower levels any time soon – even if the economy softens. A current example is energy, which is already demonstrating steady inflation (prices going up: retail gasoline, jet fuel, oil prices).
If the 10-year Treasury yield continues to climb towards 5%, I suspect this will be bad for risk assets. Examples include: aggressive growth equity allocations, emerging markets, and commercial real estate.
Bond Funds or Bonds:
As detailed earlier this year, Bond Mutual Funds and Bond ETFs are dead weight in a rising interest rate environment. Bond funds are NAV risk (rising rates) and are having a flat 2023 after a disastrous 2022. A few bond funds are profiled at the bottom of the page as examples for current and long-term performance (warning: it’s ugly).
By comparison, buying bonds individually and spreading out the maturities is smart money…take the income and rest easy. Short-term treasuries at 4.5-5.0% and investment grade (A to BBB+) corporate bonds are attractive with 6-7% coupons.
I have read comments that 60/40 is back from the dead…yes, bonds look good for income. However, I would avoid relying on a decline in interest rates and be mindful how you manage your exposure.
Equity:
US Equity has been on a tear (S&P 500 is up 21%, YTD thru July 31), a bit unexpectedly to my own admission. With a modest US Equity exposure profile combined with dollar cost averaging, US Equity has worked just fine. Overall, I continue to favor US Large Cap Value alongside broad based indices like the Russell 3000 or S&P 500.
Given the pace of the year-to-date run in US Equity…I’ve also rebalanced (sold down) some Growth/Technology exposures for conservative portfolios.
For the Satellite portion of the portfolio:
Energy and Uranium are small positions I am interested to build further. Volatility is high, patiently building positions over time.
The National Debt:
It’s been said a million times in the financial media, “the fed is trapped – they will never raise rates.” Well, they raised rates - by a lot (550 bps). The interest cost for the Federal Government’s debt is now the single largest line item expense in the federal budget. It will exceed $1 Trillion per year in 2023.
This warrants your attention by that fact that your money is being diluted. Be smart with your capital allocations: avoid low return asset classes, avoid over diversified (commoditized) asset allocation models. Keep your debts in control.
Three charts for context:
Chart #1:
I like this chart because it demonstrates how well 60/40 (stocks/bonds) worked until 2021. An impressive 40-year run of declining rates (bonds up) and stocks up. It enforces why investors need to learn to stomach volatility in the US equity market and need to think differently about bonds today.
Chart #2:
The US Equity market has richened in the 2023 rally.
https://www.currentmarketvaluation.com/models/buffett-indicator.php
Chart #3:
Congressional Budget Office: The National Debt will continue to grow. It is worth thinking about how this effects inflation…government spending is strong, not slowing.
Extra Reading: Why I keep ranting on about Bond Funds. Here are three pristine Bond Funds I’ll probably never own.
PIMCO Total Return Fund (PTTAX)
Management Fee: 0.46%
Fund Size: $54.6 Billion
Total Firm AUM: $1.7 Trillion, Industry-leading fixed income manager…Manager of the Year accolades, 40 years of experience.
Performance Snap Shot (Bad):
DoubleLine Core Fixed Income (DBLFX)
Management Fee: 0.72%
Total Firm AUM: $96 Billion, Industry Leader, Manager of the Year Accolades. Named the new Bond King a few years back (taking the moniker from PIMCO).
Performance Snap Shot (Garbage):
JP Morgan Strategic Income Opportunities Fund (JSOAX)
Management Fee: 1.00%
Fund Size: $7.4 Billion
Total Firm AUM: $2.5 Trillion, An institutional investment management power house.
Performance Snap Shot (Unexciting):
Conclusion:
Three respected bond funds struggling to produce low, single digit returns. How good do 5% short-term treasuries look now with no underlying fund management fees?
Links to complete fund fact sheets:


